
2017-2018 Winter Outlook
Summary
Last winter was one in which warmer-than-normal temperatures prevailed in the I-95 corridor during the December, January and February time period. While the month of March turned out to be at or below normal, it was not nearly enough to compensate for the prior three warmer-than-normal months. In terms of snowfall, there were noticeably higher amounts as one moved northeast along the I-95 corridor with a very low final reading of 3.4 inches in DC, a below-normal 15 inches in Philly, but just above normal in the NYC metro region at ~30 inches.
Given the expected oceanic sea surface temperature anomaly patterns around the world (e.g., La Nina in equatorial Pacific Ocean, near-normal northern Pacific Ocean), the mixed-to-positive signals for the likelihood of high-latitude blocking events, and the analysis of analog years, I believe the Mid-Atlantic region from DC-to-Philly-to-New York City will experience nearly normal overall conditions this winter. For temperatures, nearly normal would translate to -1.0 to +1.0°C for the winter season and near normal snowfall amounts should be approximately 15-25” in the DC metro region, 20-30” in Philly, and 25-35” in New York City.

Key factors
There are several key factors listed below that are crucial to this year’s Winter Outlook for the Mid-Atlantic region:
Weak La Nina conditions are likely in the tropical Pacific Ocean
Mixture of colder and warmer-than-normal water in the northern Pacific Ocean
Analog years that suggest nearly normal temperatures and precipitation
Mixed-to-positive signals from the following three factors on the likelihood for high-latitude blocking events:
Arctic Oscillation (AO) index
Snowpack increase in Siberia
Low solar activity
Detailed Analysis
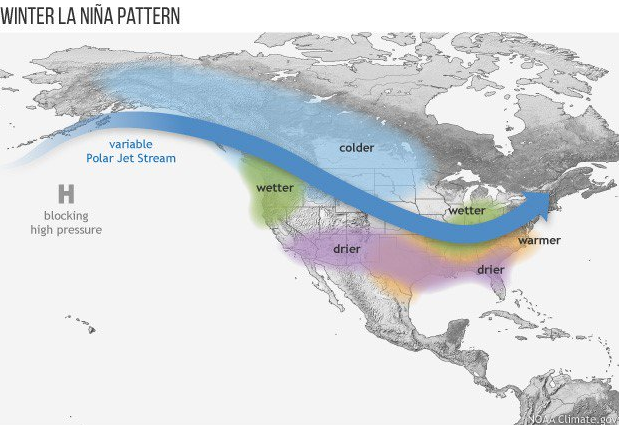
Typical La Nina winters result in colder-than-normal conditions across the Upper Midwest and Northern Plains and warmer-than-normal weather across much of the southern US; map courtesy NOAA
Overview
Last winter was one in which warmer-than-normal temperatures prevailed in the I-95 corridor during the December, January and February time period with the average temperature anomaly for the entire season at +5.1°F in Philly, +5.6°F degrees in DC, and +4.1°F degrees in NYC. While the month of March turned out to be at or below normal in the same three regions, it was not nearly enough to compensate for the prior three month warmer-than-normal period. In terms of snowfall, there were noticeably higher amounts as one moved northeast along the I-95 corridor with a very low final reading of 3.4 inches in DC, a below-normal 15 inches in Philly, but just over 30 inches in the NYC metro region which was actually a bit higher-than-normal for that location.

Numerous factors have been examined for this Winter Outlook and there are some mixed signals out there in terms of temperatures and potential snowfall for the Mid-Atlantic region. Two of the big factors last winter were weak La Nina conditions in the tropical Pacific Ocean (i.e., colder-than-normal water) and a large pool of cold water that formed in the northern Pacific early in the winter season. While it looks like we’ll have La Nina again this winter in the equatorial Pacific, the signal coming from the northern Pacific is rather muted as it is kind of a mixed bag currently of warm and cold pockets.
Key factors
There are several key factors listed below that are crucial to this year’s Winter Outlook by Vencore Weather for the Mid-Atlantic region:
1. Weak La Nina conditions are likely in the tropical Pacific Ocean
2. Mixture of colder and warmer-than-normal water in the northern Pacific Ocean
3. Mixed-to-positive signals on the likelihood for high-latitude blocking events using the following:
a. Arctic Oscillation (AO) index trend during October (neutral-to-negative signal)
b. Autumnal snowpack increase in Siberia (weak positive)
c. Continuation of low solar activity (positive)
4. Analog years that suggest nearly normal temperatures and precipitation

Sea surface temperature anomalies as of October 24, 2017; courtesy tropicaltidbits.com, NOAA
Pacific Ocean
There are two areas of interest in the all-important Pacific Ocean regarding sea surface temperature anomalies that are likely to play an important role in upcoming winter weather conditions around here in the Mid-Atlantic region. The first is the equatorial region of the Pacific Ocean to the west of South America and the second area of interest is the northern part of the Pacific Ocean just to the south of Alaska.

The vast majority of computer forecast models are predicting La Nina conditions for the upcoming winter season; courtesy IRI/CPC
In the tropical Pacific Ocean, weak La Nina conditions have replaced the weak El Nino conditions of earlier this year and it is quite likely that they will last through the upcoming winter season with an El-Nino Southern Oscillation (ENSO) index likely averaging near -0.5°C. La Nina winters tend to increase the odds of a cold winter for the Upper Midwest and Northern Plains and warmer-than-normal weather for much of the southern US. For the Mid-Atlantic region – sandwiched in between the warmer winter weather to the south and colder conditions to the northwest - La Nina often results in nearly normal overall temperatures.

JAMSTEC mid-October forecast of sea surface temperature anomalies for the upcoming winter season (December/January/February). The boxed region shows La Nina conditions (colder-than-normal, blue) in the equatorial Pacific Ocean and the circled region shows a mixed bag in the northern Pacific. (forecast map courtesy Japan Agency for Marine-Earth Science and Technology)
In the northern Pacific Ocean, warmer-than-normal water during the winter season can actually lead to numerous cold air outbreaks in the eastern US as it is usually correlated with strong upper-level high pressure ridging along the west coast of Canada. This, in turn, promotes a dip in the jet stream downstream in the eastern US which helps to promote the delivery of cold air from the northern part of Canada. This large area of warmer-than-normal water in the northern Pacific Ocean persisted in the cold winters of 2013-2014 and 2014-2015, but quickly disappeared last year early in the winter season. It is likely the disappearance of the warm blob of water in that part of the northern Pacific contributed to the warmer-than-normal winter weather experienced in the eastern US. As we head into the winter season, this year’s sea surface temperature signal in the northern Pacific is rather mixed with a blend of cold and warm pockets.

NOAA CFSv2 mid-October forecast of sea surface temperature anomalies for the upcoming winter season (December/January/February). The boxed region shows La Nina conditions (colder-than-normal, blue) in the equatorial Pacific and the circled region shows a mixed bag in the northern Pacific. (forecast map courtesy NOAA/CPC)
Analog years
In addition to the evaluation of current oceanic and solar cycles, it is quite useful for longer-range forecasting purposes to find “analog" years in which there were similar oceanic and solar cycles when compared to today. For this winter’s analog seasons, I focused only on prior La Nina winters that were preceded by an active tropical season in the Atlantic Basin which was certainly the case this year. On average, these selected analog years featured temperatures that were nearly-normal across the Mid-Atlantic region for the winter season of December-to-March, colder to the northwest and warmer to the south - rather typical for La Nina winters.
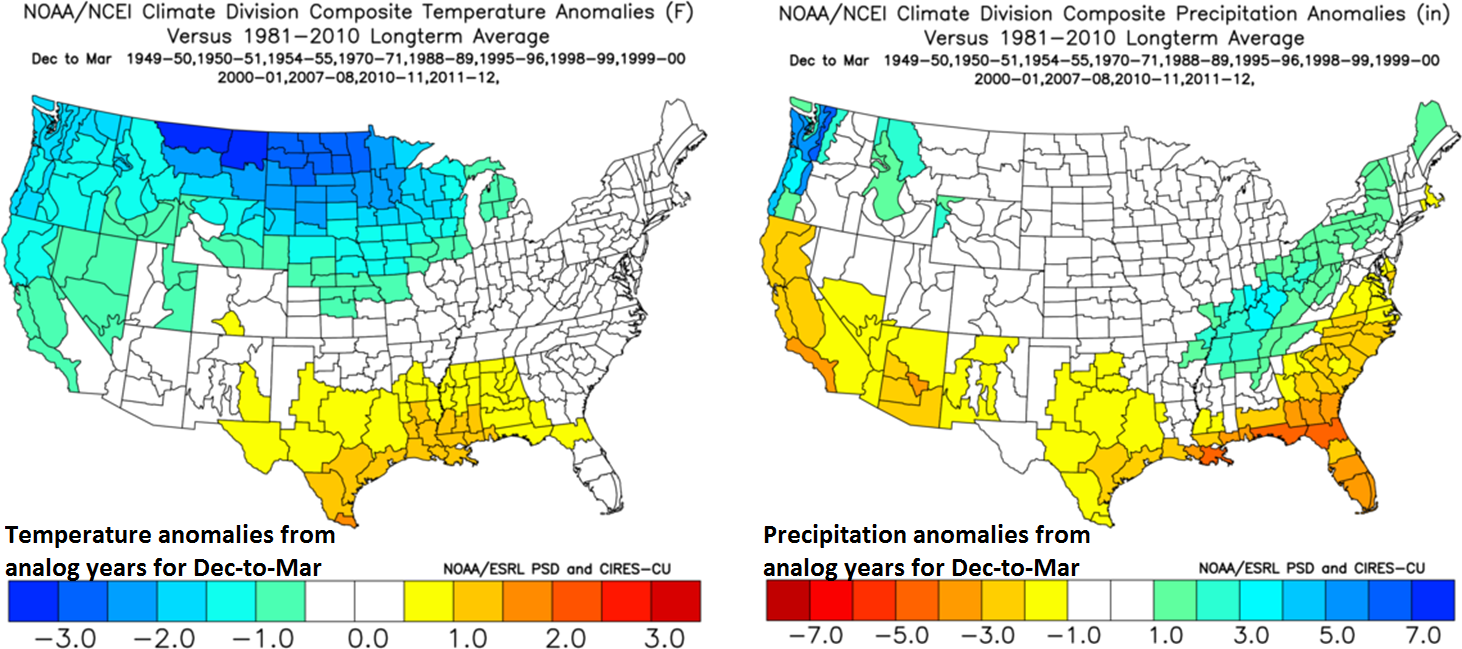
December-to-March temperature (left) and precipitation (right) anomaly patterns for my chosen analog years; composite plots courtesy NOAA
As far as precipitation is concerned, these same analog years featured on average near-normal amounts along the I-95 corridor which - given the expected near normal temperatures - should translate into near normal amounts of snowfall for the I-95 metro regions from DC-to-Philly-to-New York City. While there certainly can be some coastal storm activity this winter, the threat for blockbuster type nor’easters is somewhat diminished in a La Nina winters when compared to El Nino years. In El Nino winters, the warmer-than-normal water in the tropical Pacific tends to activate the southern branch of the jet stream which, in turn, often results in big coastal storms – that is not as likely this year with the expected La Nina conditions.
High-latitude blocking
In addition to the examination of oceanic sea surface temperature anomalies, it is valuable in the long-range forecasting of winter weather in the Mid-Atlantic region to evaluate the prospects for “high latitude blocking” events in the atmosphere. High-latitude blocking during the winter season is characterized by persistent high pressure in northern latitude areas such as Greenland, northern Canada, and Iceland. Without this type of upper-level pattern, it is quite difficult to get sustained cold air outbreaks in the Mid-Atlantic region during the winter season and that is usually a critical requirement for snowstorms in the I-95 corridor.
Three signals that can provide clues as to the prospects for high-latitude blocking events this winter include the Arctic Oscillation (AO) index, snowpack across Siberia, and solar activity levels – and these signals are mixed-to-positive.
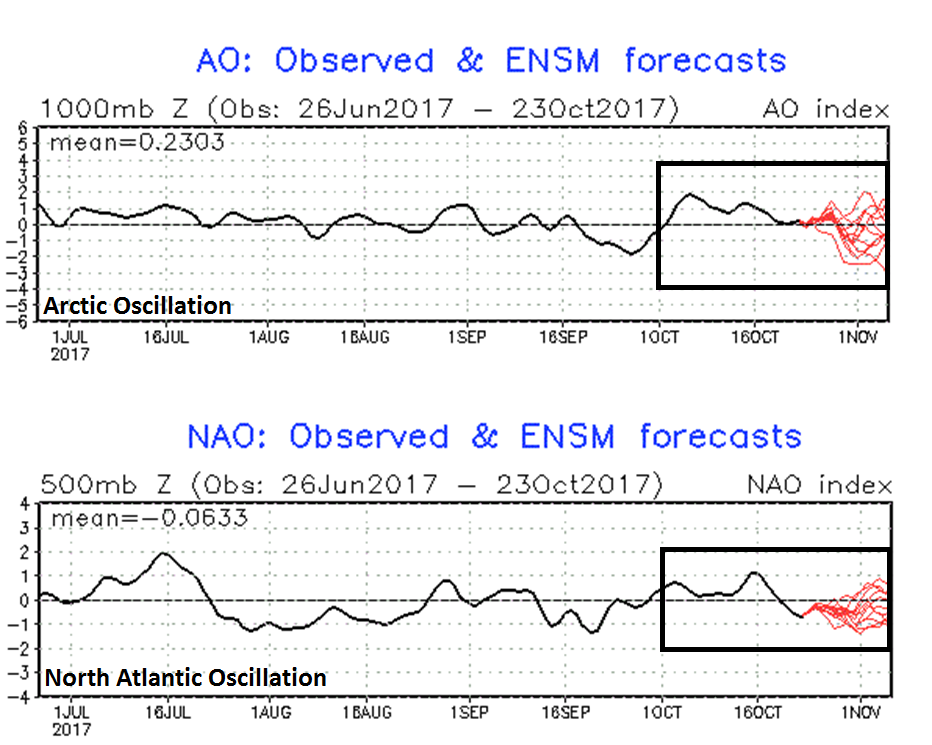
Arctic Oscillation (top) and North Atlantic Oscillation (bottom) index values (in black) through October 23rd with model forecasted values in red; courtesy NOAA
The Arctic Oscillation signal
High-latitude blocking is tracked by meteorologists through indices known as the Arctic Oscillation (AO) and its closely-related cousin called the North Atlantic Oscillation (NAO). The Arctic Oscillation refers to opposing atmospheric pressure patterns in middle and high latitudes. When the AO is positive, for example, surface pressure is low in the polar region and this helps the mid-latitude jet stream to blow strongly and consistently from west-to-east keeping Arctic air locked up in the polar region. When the AO index is negative, there tends to be high pressure in the polar regions (i.e., high-latitude blocking), weaker zonal winds, and greater movement of polar air into the middle latitudes such as the Mid-Atlantic region. While the AO and NAO indices are primarily used during by forecasters during the winter season, trends in the fall season can provide important clues about the ensuing winter season. Specifically, negative AO index values in October typically translate to negative values during the following winter season, but the trend this October has been primarily on the positive side or in the neutral zone.

Change of snow cover (white areas) in Siberia between October 1st (left) and October 23rd (right); data courtesy NOAA
The "Siberian snowpack "signal
In addition to the Arctic Oscillation signal, snowpack in Siberia during the autumn season has also been found to be an important predictive factor with respect to high-latitude blocking patterns during subsequent winter seasons. In fact, research studies have actually pinpointed the region in Siberia below 60°N during the month of October as critical with respect to the likelihood of high-latitude blocking patterns during the following winter season. If snowpack is above-normal and consistently expanding during October in that part of Siberia, research studies and empirical observations suggest there is an increased chance for more frequent high-latitude blocking configurations in subsequent winter months. In fact, there has been a increase in snowpack across Siberia during the first half of October including in the region south of 60°N, but perhaps not quite as dramatic as in recent years.
Low solar activity
Research and empirical observations have shown that low solar activity tends to be correlated with frequent high-latitude atmospheric blocking patterns and we are now experiencing one of the weakest solar cycles (#24) in more than a century. Furthermore, this already weak solar cycle is headed rapidly towards the next solar minimum - usually the least active time in a given cycle. In fact, the last solar minimum from 2007-to-2009 registered the quietest period in at least a century. The “analog years” plot (below) shows upper-level height anomalies in previous low solar activity years (i.e., during solar minimum phases) and high pressure tended to dominate near Greenland and Iceland (orange, red regions) which typically leads to sustained cold air outbreaks into the eastern US. Based on the actual results of these previous low solar activity years, odds would favor high-latitude blocking scenarios this upcoming winter season given the strong likelihood for low solar activity to continue through the winter months.
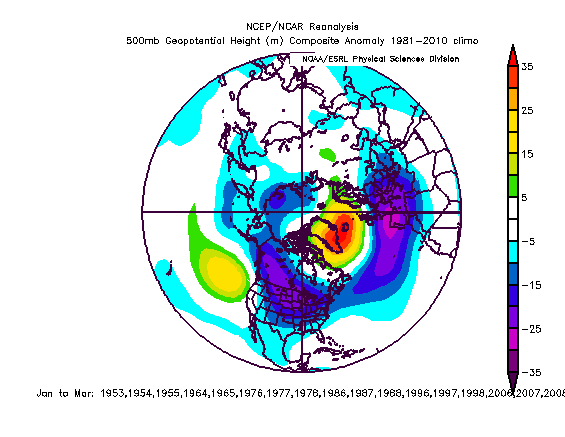
Typical upper-atmosphere (500 mb) height anomaly pattern during years of low solar activity; courtesy NOAA/NCEP
The bottom line
Given the expected oceanic sea surface temperature anomaly patterns around the world (e.g., La Nina in equatorial Pacific Ocean, near-normal northern Pacific Ocean), the mixed-to-positive signals for the likelihood of high-latitude blocking events, and the analysis of analog years, I believe the Mid-Atlantic region from DC-to-Philly-to-New York City will experience nearly normal overall conditions this winter. For temperatures, “nearly normal” would translate to -1.0 to +1.0°C for the winter season and near normal snowfall amounts should be approximately 15-25” in the DC metro region, 20-30” in Philly, and 25-35” in New York City.
Meteorologist Paul Dorian
Vencore, Inc.
vencoreweather.com