
11:00 AM | *Arctic sea ice turns the corner for the year*
Paul Dorian

Source: using EUMETSAT satellite data to determine Arctic sea ice extent where sea ice concentration is greater than or equal to 15%; http://osisaf.met.no/quicklooks/sie_graphs/nh/en/osisaf_nh_iceextent_daily_5years.png
Overview
Arctic sea ice extent has seemingly just passed its low point of the melting season with a rather sharp uptick in recent days (circled region). Arctic sea ice generally shrinks every year during the spring and summer seasons until it reaches its minimum yearly extent around this time. Sea ice then typically regrows during the frigid fall and winter seasons when the sun is below the horizon in the Arctic. The apparent end to this year’s melting season in the Arctic around September 10th was actually a bit sooner than in some recent years and perhaps the earliest turnaround since the late 1990s. For example, in the record low year of 2012 for Arctic sea ice extent, the turning point marking the end of the melting season took place around September 16th.

Observed AMO index, defined as detrended 10-year low-pass filtered annual mean area-averaged SST anomalies over the North Atlantic basin (0N-65N, 80W-0E), using HadISST dataset (Rayner, et al., 2003) for the period 1870-2015.; courtesy NCAR: https://climatedataguide.ucar.edu/climate-data/atlantic-multi-decadal-oscillation-amo
While Arctic sea ice extent appeared to be headed for record lows earlier this year, the melting rate changed pace and actually slowed down in the summer months. The low point just reached is clearly still below the normal value for the 1981-2000 time period, but it is actually quite comparable to the minimums seen during each of the last three years - and safely above the record low seen in 2012. The Arctic sea ice extent has been generally below normal since the middle 1990’s at which time the northern Atlantic Ocean switched sea surface temperature phases from cold-to-warm and it is likely to return to pre-mid 1990’s levels when the ocean cycle flips back to cold. Meteorologists track oceanic temperature cycles in the northern Atlantic Ocean with an index value known as the Atlantic Multidecadal Oscillation (AMO). The AMO flipped from negative-to-positive in the mid 1990's signaling an important long-term sea surface temperature phase shift from cold-to-warm and it has stayed positive ever since. Typically, oceanic temperature cycles in the Atlantic Ocean have lasted for about 20 to 30 years.

Source: Danish Meteorological Institute (red line represents actual temperatures, green line represents normal temperatures); http://ocean.dmi.dk/arctic/meant80n.uk.php
2016 mean temperatures in the Arctic
While actual temperatures (red line) in the Arctic were generally running at well above-normal levels during the first few months of the year, they were close-to-normal during the summer season which is when the sun shines nearly 24 hours a day and the vast majority of the melting normally takes place. Above-normal temperatures during the winter and early spring season do little to impact overall Arctic sea ice melting as temperatures are generally still well below the freezing point (273.15 Kelvin represented by the horizontal blue line on plot, i.e., the freezing point of water). In fact, any abnormal warming that has taken place around the world in recent years has largely been confined to the winter seasons in the polar regions of the Arctic and Antarctica.
The sharp uptick in Arctic sea ice extent during the past few days is seemingly a contradiction with the sharp uptick seen in temperatures (indicated by arrow on Arctic temperatures plot); however, it makes physical sense considering when water freezes it actually releases its specific latent heat (an exothermic reaction). [The specific latent heat is defined as the amount of energy required to convert 1 kg (or 1 lb) of a substance from solid to liquid (or vice-versa) without a change in the temperature of the surroundings — all absorbed energy goes into the phase change — is known as the specific latent heat of fusion].
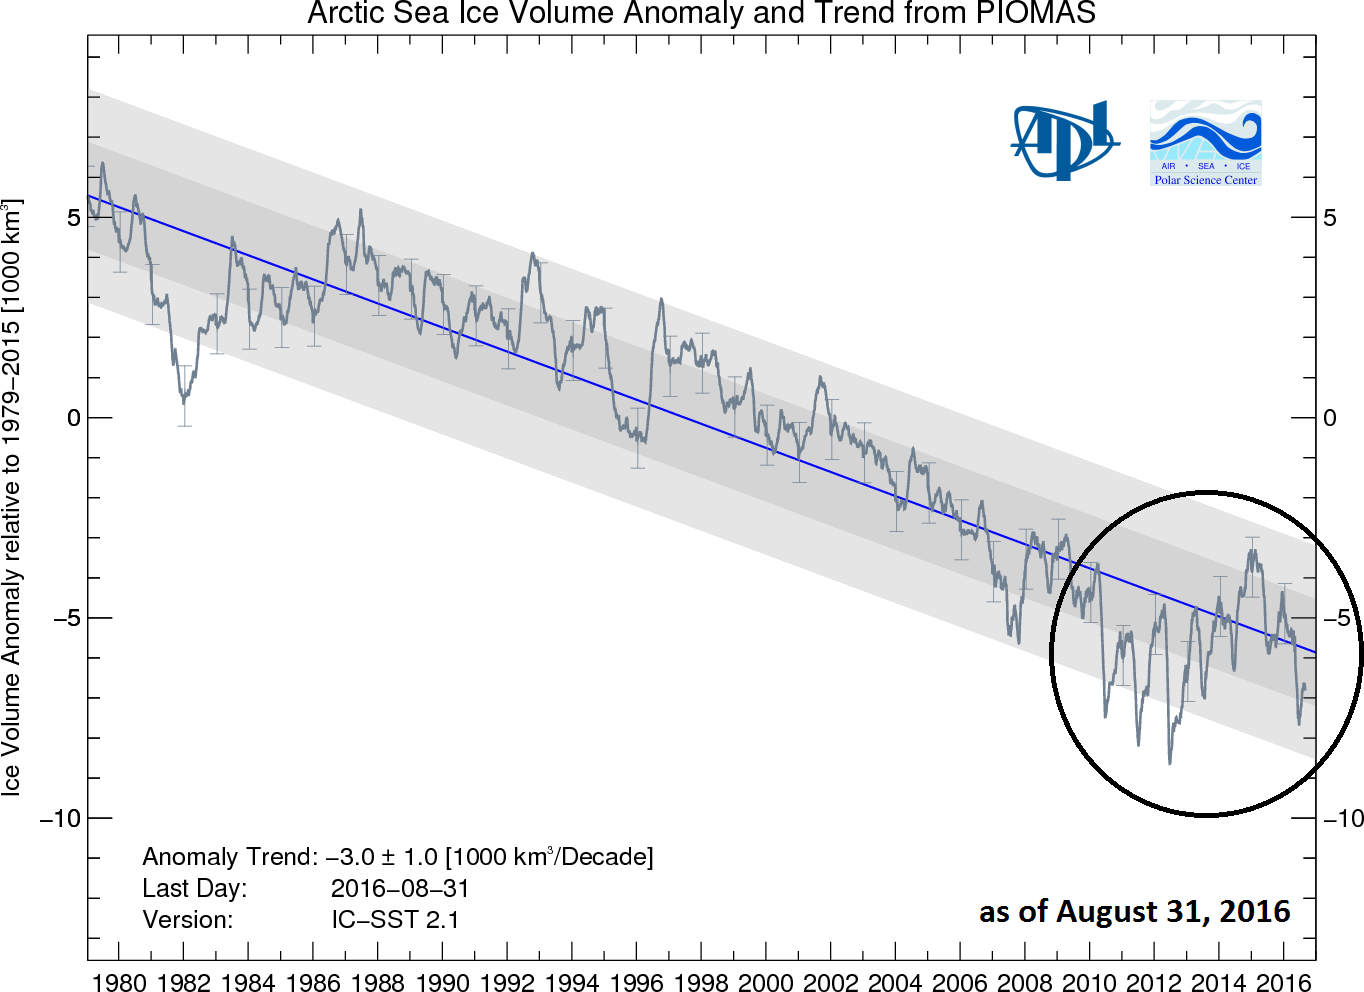
Source: Arctic sea ice volume anomaly and trend since 1979 from PIOMAS model, University of Washington; http://psc.apl.uw.edu/wordpress/wp-content/uploads/schweiger/ice_volume/BPIOMASIceVolumeAnomalyCurrentV2.1.png
Arctic sea ice volume showing some resiliency since low point of 2012
In addition to sea ice extent, an important climate indicator to monitor is sea ice volume as it depends on both ice thickness and extent. Arctic sea ice volume cannot currently be observed on a continuous basis as observations from satellites, submarines and field measurements are all limited in space and time. As a result, one of the best ways to estimate sea ice volume is through the usage of numerical models which utilize all available observations. One such computer model from the University of Washington is called the Pan-Arctic Ice Ocean Modeling and Assimilation System (PIOMAS, Zhang and Rothrock, 2003) and it is showing some resiliency (circled area above) in Arctic sea ice volume since the low point was reached in 2012 following a long and sustained sharp downtrend. (Note – the PIOMAS model output data is updated on a monthly basis, details on the PIOMAS model are available at http://psc.apl.washington.edu/research/projects/arctic-sea-ice-volume-anomaly).
Another way to visualize the change in trend and resiliency for sea ice extent in the Northern Hemisphere (NH) is to break it down on a "decade-by-decade" basis going back to when satellite observations began (1979). On this "decade-by-decade" plot (below), the sharp downward trend in NH sea ice area began in the middle 1990's shortly after the Northern Atlantic Ocean sea surface temperature phase changed from cold-to-warm. There was then a sharp downtrend in NH sea ice between 1997 and 2007, but that has been followed by a much more stable and generally "sideways' trend (circled area below) to the present day.

The derivation of this graph of Northern Hemisphere sea ice area is detailed here:
https://climategrog.wordpress.com/2013/09/16/on-identifying-inter-decadal-variation-in-nh-sea-ice
Antarctica sea ice situation quite different than Arctic region
We’ll continue to monitor any changes in Arctic sea ice extent and volume in coming months here at VencoreWeather.com and we’ll also watch the overall situation in the southern hemisphere. Interestingly, while the Arctic sea ice extent has been generally below-normal in recent years, Antarctica has often been running at above-normal levels. A recent report from NASA has found that since 1986, there hasn’t been a single record high in Arctic sea ice extent in any month of the year and there have been 75 record lows. However, in Antarctica, where the trends are toward more rather than less sea ice, there have only been six record monthly record lows after 1986 and 45 record highs (Source NASA; http://climate.nasa.gov/news/2496/arctic-sea-ice-annual-minimum-ties-second-lowest-on-record/).
Meteorologist Paul Dorian
Vencore, Inc.