
12:15 PM | *Numerous signs point to the return of a colder-than-normal pattern for the eastern US during late February and March*
Paul Dorian
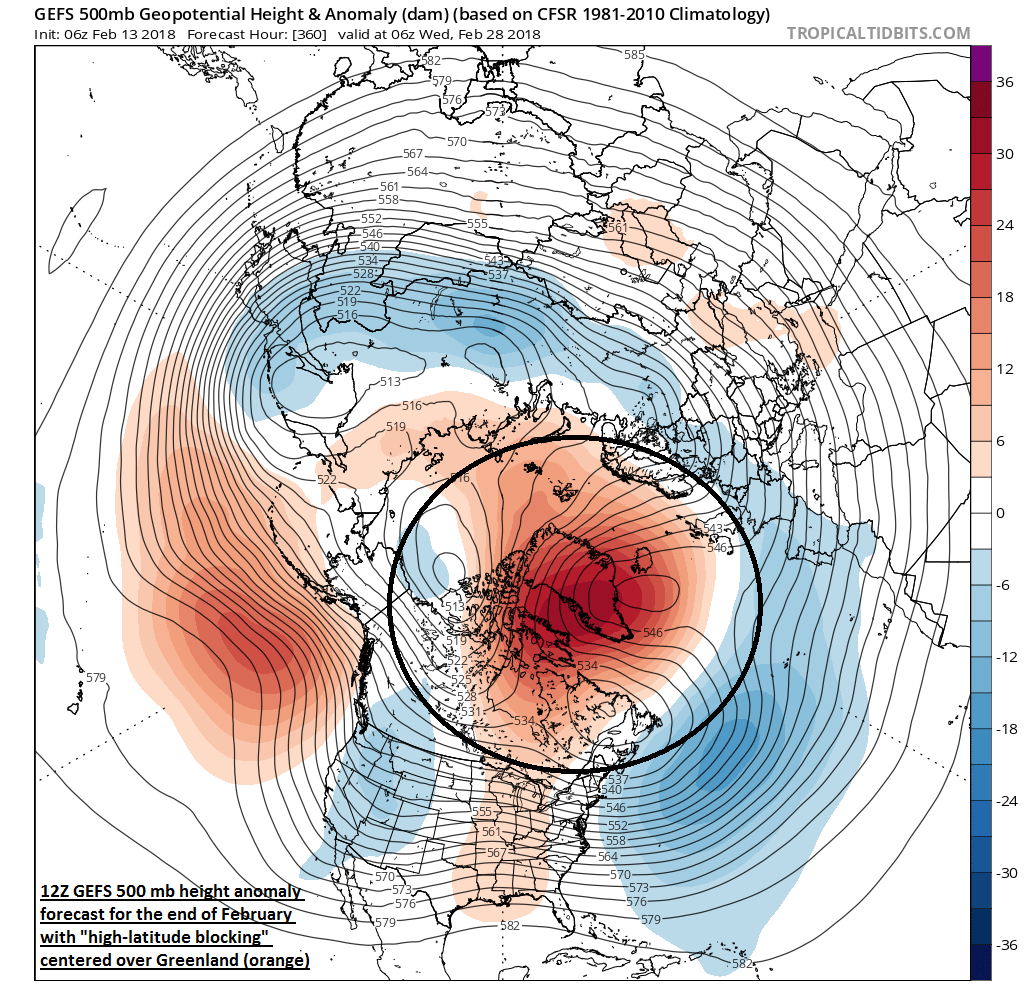
"High-latitude blocking" is predicted by the latest GEFS model forecast by the end of February with abnormally high heights at 500 mb centered over Greenland (circled region); map courtesy NOAA
Overview
There is abundant very cold air around in the Northern Hemisphere (e.g., Arctic dips to -76°F) as we reach the mid-point of February and snowfall has been very impressive in recent days from British Columbia-to-Chicago-to-Paris-to-Moscow, but unless the atmospheric flow pattern changes, this abnormal cold and potential snow won’t necessarily come to the eastern US. In fact, the weather pattern in the eastern US has featured multiple mild spells in recent days and little in the way of snowfall for the immediate I-95 corridor, and the overall mild weather pattern looks like it will continue for the next week-to-ten days. After that, however, there are numerous signs that suggest there will be a crucial change to the overall atmospheric pattern over the Northern Hemisphere and this will likely allow for multiple cold air outbreaks to once again be directed into the eastern US.

Arctic Oscillation (top) and North Atlantic Oscillation (bottom) indices are forecasted (in red) to drop sharply into negative territory towards the end of the month and this is supportive of the idea of "high-latitude blocking" to develop; maps courtesy NOAA
"High-latitude blocking", Arctic Oscillation, North Atlantic Oscillation
“High-latitude blocking” is one type of change to the overall pattern that would allow for Arctic air masses to once again penetrate into the eastern US and indeed, it looks increasingly likely that this will develop by the end of the month. “High-latitude blocking” in the wintertime involves higher-than-normal pressure in places like Greenland, Iceland and northeastern Canada and it is important to monitor as it often results in sustained cold air outbreaks for the central and eastern US. The latest runs of the GFS and European computer forecast models feature abnormally high pressure in these particular areas by the end of the month and the predicted tanking of the Arctic Oscillation (AO) and North Atlantic Oscillation (NAO) indices support this idea for the formation of "high-latitude blocking".
The AO and NAO indices provide information to meteorologists on the ever-changing pressure and temperature patterns across the northern latitudes and they are closely monitored this time of year for potential impacts to the eastern US. When these indices drop into negative territory for extended periods of time, the chances for “high-latitude blocking” generally increases. Indeed, both of these indices are projected to simultaneously drop rather sharply into negative territory over the next couple of weeks suggesting “high-latitude blocking” may indeed develop, and computer forecast models are now picking up on this idea. In fact, the most recent GEFS model forecast for 500 mb height anomalies strongly suggests that “high-latitude blocking” will form by the end of the month with abnormal high pressure predicted to be centered over Greenland and this is a crucial pattern change that should allow Arctic air masses to drop into the eastern US from late February into March.
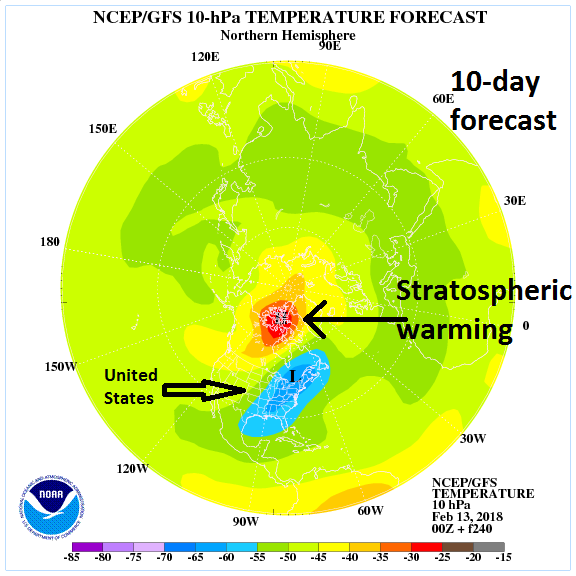
Top-down view of the forecasted stratospheric (10-mb) temperatures in ten days with very warm conditions near the North Pole (North Pole is at center-point of this forecast map) and the dominant polar vortex is shunted to the North American side of the pole; map courtesy NOAA
Sudden Stratospheric Warming
In addition to the changes coming to the atmosphere as suggested by the forecast of the AO, NAO indices, there has been a sudden increase in stratospheric temperatures in recent days near the North Pole and this will likely ultimately result in a dominant center of the polar vortex to be located on the North American side of the pole in another week or so. Sudden Stratospheric Warmings (SSWs) are among the most impressive dynamical events in the physical climate system and they can have dramatic consequences on the overall pattern across the Northern Hemisphere.

Daily stratospheric temperature analysis shown in red for the northern latitudes region of 90°N to 65°N showing a sudden spike in recent days (indicated by arrow); map courtesy NOAA
During the winter months in the polar stratosphere, temperatures are typically lower than minus 70° Celsius. The cold temperatures are combined with strong westerly winds that form the southern boundary of the stratospheric polar vortex which plays a major role in determining how much Arctic air spills southward toward the mid-latitudes. This dominant structure is sometimes disrupted in some winters or even reversed. Under these circumstances, the temperatures in the lower stratosphere can rise by more than 50°C in just a few days. This sets off a reversal in the west-to-east winds and the collapse or displacement of the polar vortex.
In response to the stratospheric warming and associated layer expansion at the high latitudes, the troposphere in turn contracts and cools down dramatically. This tropospheric cold air can then be transported from the high latitudes to the middle latitudes given the right overall weather pattern (e.g., "high-latitude blocking"). The tropospheric response to the SSWs closely resembles the negative phase of the North Atlantic Oscillation (NAO), involving an equatorward shift of the North Atlantic storm track; extreme cold air outbreaks in parts of North America, northern Eurasia and Siberia; and strong warming of Greenland, eastern Canada, and southern Eurasia (Thompson et al., 2002). The entire process from the initial warming of the stratospheric at high latitudes to the cooling in the troposphere at middle latitudes can take weeks to unfold.

Euro model forecast of the MJO index in coming days (shown in green) with a counter-clockwise movement from phase 7 into phases 8 and then phase 1 by the end of February; map courtesy NOAA
Madden Julian Oscillation
Yet another signal that suggests colder-than-normal weather is possible in the eastern US in coming days is known as the Madden Julian Oscillation (MJO). The MJO is a tropical disturbance that propagates eastward around the global tropics with a cycle on the order of 30-60 days. It is a large-scale coupling between atmospheric circulation and tropical deep convection (thunderstorms). The movement of the MJO not only has wide ranging impacts on the patterns of precipitation, surface temperatures, and atmospheric circulation in the tropics, but it also influences precipitation and temperature patterns across the globe. One significant impact of the MJO over the U.S., for example, can be an increase in the frequency and intensity of cold air outbreaks across central and eastern sections of the nation during the northern hemisphere winter.

The phase of the MJO usually translates to certain temperature patterns across the US depending on the time of year. Phases 8 and 1 during the January/February/March time period typically result in colder-than-normal conditions in the eastern US; maps courtesy NOAA
Research has found that the location of the MJO, or phase, is linked with certain temperature and precipitation patterns around the world. The MJO phase diagram illustrates the recent and forecasted progression of the MJO index through different phases which generally coincide with locations along the equator around the globe. The very latest Euro model forecast suggests the MJO will moves into and through phase 8 as we progress to late-February and then into phase 1 (follow green line in forecast map in a counter-clockwise fashion). These particular phases suggest colder-than-normal conditions this time of year for the eastern US.
Meteorologist Paul Dorian
Vencore, Inc.
vencoreweather.com