*2021-2022 Winter Outlook*
Paul Dorian

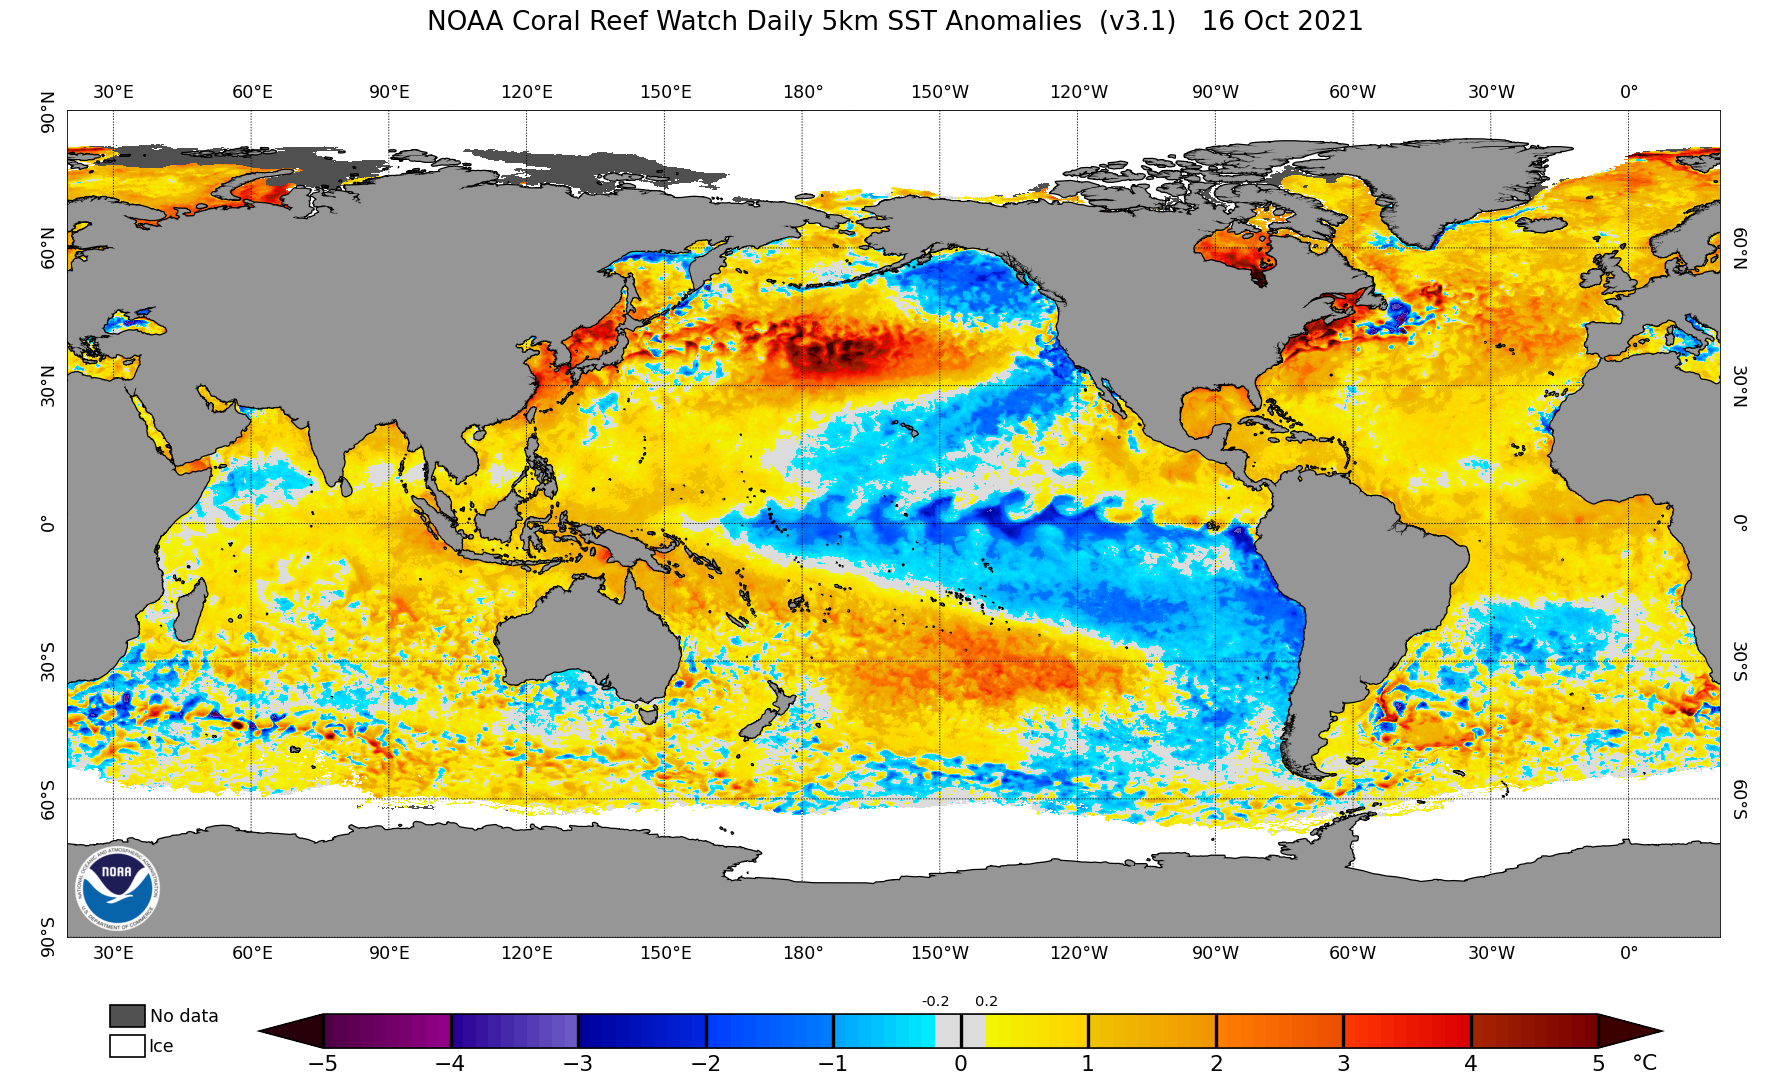
Current sea surface temperature anomalies are shown from around the world and, similar to last winter, there are La Nina conditions in the central part of the Pacific Ocean (i.e., colder-than-normal, shown in blue). One difference from last winter is the colder-than-normal water tucked in just off of Alaska’s southern coastline in the northeastern Pacific. Map courtesy NOAA (as of 16 October 2021)
Overview
The winter season of 2020-2021 featured La Nina conditions in the equatorial part of the Pacific Ocean which then weakened to near neutral status during the spring and summer of this year. New cooling has formed in the same region and it appears that a second year La Nina will take place for the upcoming winter season. Sea surface temperature anomalies in the central Pacific Ocean were but one of several factors considered in the 2021-2022 “Winter Outlook”.
Key Factors
Some of the key factors considered for this year’s “Winter Outlook” are listed below:
1. Weak-to-moderate La Nina in the equatorial Pacific Ocean
2. An analysis of temperature and precipitation patterns in analog years that were chosen by a comparison with the following:
a. Sea surface temperature anomalies
b. Solar activity
c. Atlantic Basin tropical activity
3. Some favorable signs for high-latitude blocking with consideration of:
a. solar activity (low)
b. autumnal snowpack in the Northern Hemisphere
c. trends in teleconnection indices such as AO, NAO
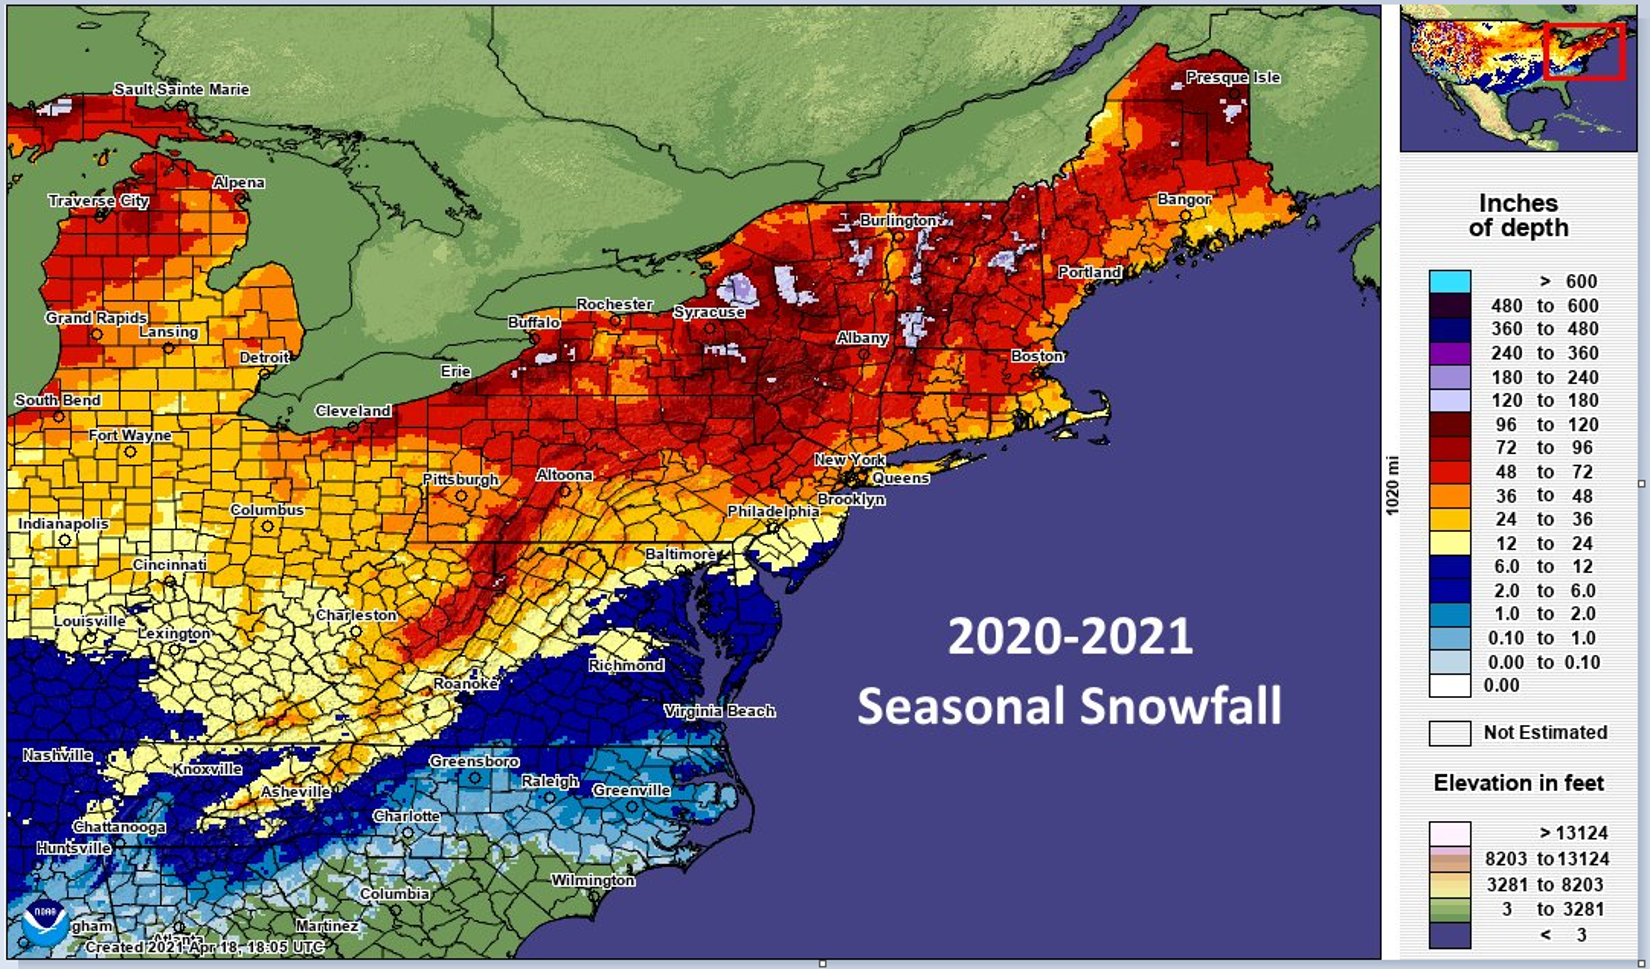
Last winter featured above-normal snowfall levels in many spots to the north of the Pennsylvania/Maryland border with the city of Philadelphia receiving 23.9” and 38.6” in New York City. Meanwhile, snowfall amounts were generally below-normal to the south of the Mason Dixon Line with only 5.4” recorded in Washington, D.C.
Recap of last winter
Last year’s winter season generally featured above-normal temperatures in the Mid-Atlantic region, but snowfall anomalies were quite variable and largely dependent on specific location. In many areas to the north of the Pennsylvania/Maryland border such as in the Philadelphia and New York City metro areas, snowfall was typically above-normal last year; but, it was generally below-normal to the south of the Mason-Dixon Line including in and around the Washington, D.C. metro region. Across the rest of the nation, last winter will most likely be remembered for an extremely cold air mass that plunged all the way down into Texas during the month of February which was accompanied by an unusual amount of snow and ice for that part of the nation. Another highlight from last winter was the fact that Denver, Colorado recorded its snowiest winter ever as there was an extended snow season in many of the Rocky Mountain States lasting from September 2020 into April of 2021.

Rolling 3-month averages of sea surface temperature anomalies as generated by a series of dynamical and statistical computer forecast models are shown in this plot for the central part of the Pacific Ocean. The compilation of model forecasts issued during September 2021 suggests a weak-to-moderate La Nina is in the offing for the upcoming winter season. Plot courtesy International Research Institute for Climate and Society
NOAA’s climate model known as the CFSv2 predicts there will be a moderate-to-strong La Nina this winter season in the equatorial part of the Pacific Ocean (shown in blue). Map courtesy NOAA (issued October 17, 2021)
Weak-to-moderate La Nina in the equatorial Pacific Ocean
The Pacific Ocean is the largest on the planet, covers more than 30 percent of the Earth’s surface, and is bigger than the landmass of all the continents combined. The warm waters of the equatorial Pacific Ocean store a great amount of latent heat when compared to cooler waters and breed a great deal of convection which impacts downstream ridging and troughing in the atmosphere. As such, its sea surface temperature (SST) pattern has a tremendous influence on all weather and climate around the world and the more anomalous the sea surface temperatures, the more the impact can be on the atmosphere around the world. The El Nino-Southern Oscillation (ENSO) is a recurring climate pattern involving changes in the temperature of waters in the central and eastern tropical Pacific Ocean. El Nino and La Nina are the extreme phases of the ENSO cycle; between these two phases is a third phase called ENSO-neutral.

Sub-surface colder-than-normal water in the tropical Pacific Ocean (shown in blue) will likely “bubble” up to the surface in coming weeks supporting the notion of a second La Nina type of winter. Plot courtesy NOAA/CPC
During last winter season, La Nina conditions (i.e., colder-than-normal) persisted in the equatorial part of the Pacific Ocean and then they weakened to a nearly neutral state during this past spring and summer. New cooling has recently formed in the same part of the Pacific Ocean and it appears to me that weak-to-moderate La Nina conditions will take during the upcoming winter season. In fact, it is not unusual to have two La Nina events follow each other with eight of the twelve “first-year” La Nina events since 1950 followed by a second year episode during the subsequent winter season.

La Nina will likely be the dominant player this winter season in the equatorial Pacific Ocean with colder-than-normal sea surface temperatures. Typically, this type of oceanic sea surface temperature pattern leads to a strong polar jet across Canada and much of the northern US and colder-than-normal conditions from Alaska to the Northern Plains. In addition, La Nina winters are often warmer and drier than normal in much of the southern US from California-to-Florida.
An analysis of analog years
It is quite useful, in my opinion, for long-range forecasting purposes to find analog years in which there were similar overall conditions compared to today’s environment. A review of temperature and precipitation patterns in these selected analog years can provide some useful clues as to what can be expected in the forthcoming winter season. There were three environmental factors that I evaluated in order to determine if a given year was sufficiently qualified to be selected as an analog. First, there had to be a well-established La Nina in the tropical Pacific Ocean that encompassed the spring and summer seasons of the given year in terms of the rolling 3-month SST anomalies. Second, the year of interest had to feature low solar activity as I expect that to be the case this upcoming winter season. Third, the Atlantic Basin hurricane season had to be quite active in the year of interest – as has been the case this year - with 15 or more named tropical storms.
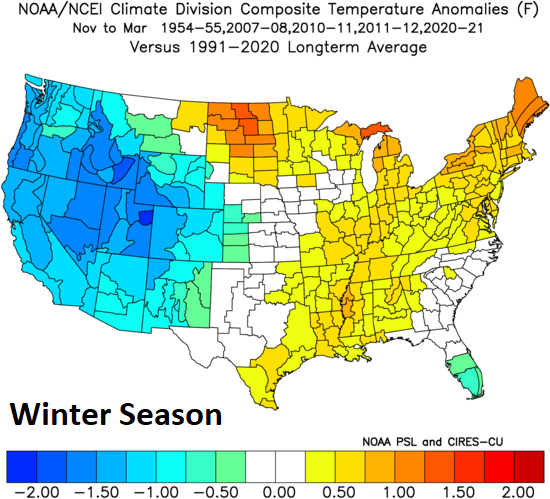

US temperature (top) and precipitation (bottom) anomalies averaged together during the November-to-March time period for the five selected analog years. Data courtesy NOAA/PSL
The following 5 years met these qualifications: 1954, 2007, 2010, 2011 and 2020. When averaged together, these five analog years produced a pretty clear signal for colder-than-normal conditions in the western states and near-to-slightly above-normal temperatures in the Mid-Atlantic region.
The overall signal from the analog years’ precipitation anomaly pattern is for nearly normal total precipitation amounts in the Mid-Atlantic region; however, there was a tendency for this slightly above-normal amounts to the north of the Pennsylvania/Maryland border and slightly below-normal levels to its south. Much of the southern half of the nation is likely to experience drier-than-normal weather this winter season based on analysis of these analog years and the expectation of high pressure ridging to persist in the Southeast US. In addition, there is reason to believe that the winter may be “front-loaded” in the Mid-Atlantic region and get off to an early start later in November and with a strong signal for a cold month of December based on the review of these five analog years.


Temperature anomalies (top) for the month of December when averaged together for the five analog years had a clear signal of colder-than-normal conditions in much of the eastern US and near-to-slightly above-normal precipitation in the Mid-Atlantic region. This finding from the analog years suggests there could be a quick start to winter this year in the Mid-Atlantic with more snow than normal before Christmas. Data courtesy NOAA
Some favorable signs for high-latitude blocking
As any snow lover and weather enthusiast knows living in the Mid-Atlantic and Northeast US, it takes many ingredients to fall into place for a snowstorm to actually take place; especially, in the urban areas of DC, Philly, New York City and Boston. One requirement for accumulating snow is, of course, cold air that is near or below the freezing mark, but it can be a little more complicated than that. It is one thing to have cold air around at the beginning of a potential snowstorm, but the best chance for significant snow comes when there is sustained cold air. If there is no mechanism for “locking in” the cold air, you could very well end up with a snow-changing-to-rain scenario; especially, in the big cities along the I-95 corridor and in areas closer to the east coast.
One of the ways to sustain a cold air mass in the Mid-Atlantic/Northeast US is to have an atmospheric phenomenon known as high-latitude blocking. Normally, there is an Arctic low pressure system over the polar region where cold air tends to be trapped. This system can become displaced or even reversed in the wintertime if warmer air pushes into northern latitude regions and a “blocking” pattern can form which can unleash cold air into the middle latitudes. High-latitude blocking during the winter season is characterized by persistent high pressure in northern latitude areas such as Greenland, northeastern Canada, and Iceland. Without this type of blocking pattern in the upper atmosphere, it is more difficult to get sustained cold air masses in the central and eastern US as well as, in turn, accumulating snowfall.
Three signals that can provide clues as to the prospects for high-latitude blocking in an approaching winter season include overall solar activity, the buildup of snowpack buildup in the Northern Hemisphere during the fall season, and autumnal trends in teleconnection indices such as the Arctic Oscillation (AO) and North Atlantic Oscillation (NAO). All three of these signals tend to support the notion that high-latitude blocking may indeed be prevalent at times during this upcoming winter season which tends to favor periods of colder-than-normal weather in the central and eastern US and perhaps more snow than normal. In fact, there have already been some early “blocking” type patterns across the northern latitudes during this fall season which really did not take place a year ago.

Solar cycles in recent decades have been in an overall weakening trend with daily observations of the number of sunspots in a general downward trend since 1977. The thin blue line indicates the daily sunspot number, while the dark blue line indicates the running annual average. Data source: Solar Influences Data Analysis Center (SIDC), WDC-SILSO, Royal Observatory of Belgium, Brussels, climate4you.com. Last diagram update: 05 October 2021.
1) Low solar activity
In the long term, the sun is the main driver of all weather and climate and multi-decadal trends in solar activity can have major impacts on oceanic and atmospheric temperatures. In addition, empirical observations have shown that the sun can have important ramifications on weather and climate on much smaller time scales. For example, observations have shown that low solar activity winter seasons tends to be pretty well correlated with frequent high-latitude blocking events. We are currently in the beginning stages of a solar cycle 25 and solar activity should hold at relatively low levels during the upcoming winter season.

Low solar activity years going back to 1950 show a good correlation with abnormally high geopotential height anomalies at 500 millibars (“blocking”) over high-latitude regions such as Greenland and Iceland (shown in red, orange, yellow, green); Data courtesy NOAA/NCAR Reanalysis
A look at 500 millibar height anomalies from recent solar minimum time periods in the winter season shows a clear signal of high-latitude blocking with higher-than-normal geopotential heights a dominant feature near Greenland and Iceland. This type of upper air pattern which is prevalent during low solar activity winters can lead to numerous sustained cold air outbreaks into the central and eastern US during a given winter season and also favors more snow than normal. In fact, some of the greatest snowstorms in the Mid-Atlantic/Northeast US took place in low solar activity winters including, for example, those in January 1996, December 2009 and February 2010. There are, of course, other important factors to consider in the prediction of snowfall amounts along the I-95 corridor including sea surface temperatures in the western Atlantic Ocean and the positioning of polar and sub-tropical jet streaks.

The 500 mb geopotential height anomalies averaged together in the winter season of the five analog years featured higher-than-normal geopotential height anomalies at 500 millibars (“blocking”) over northeastern Canada/Greenland and much of the polar region as well as over the Pacific Ocean (shown in red, orange, yellow, green). Data courtesy NOAA/NCAR Reanalysis
2) The "Siberian snowpack" signal
Snowpack in the Northern Hemisphere and, in particular, Siberia during the autumn season has been found to be an important predictive factor with respect to high-latitude blocking patterns during subsequent winter seasons. In fact, research studies have actually pinpointed the region in Siberia below 60°N during the month of October as critical with respect to the likelihood of high-latitude blocking patterns during the following winter season. Specifically, if snowpack is above-normal and consistently expanding during the month of October in that part of Siberia, there is some reason to believe that there is an increased chance for more frequent high-latitude blocking patterns in subsequent winter months. In fact, there has been some increase in snowpack across Siberia during the first couple of weeks of October, but nothing out of the ordinary.

Snowpack has increased some across Eurasia during the first half of October, but nothing out of the ordinary. Research has shown that a rapid increase in snow in that particular region can increase chances for sustained cold air outbreaks into the central and eastern US in subsequent winter months. Snow maps courtesy NOAA/National Ice Center (October 1st, left; October 15th, right)
3) Recent trends in teleconnection signals (AO, NAO)
High-latitude blocking is tracked by meteorologists through indices known as the Arctic Oscillation (AO) and its closely-related cousin called the North Atlantic Oscillation (NAO). The AO refers to opposing atmospheric pressure patterns in middle and high latitudes. When the AO is positive, for example, surface pressure is low in the polar region and this helps the mid-latitude jet stream to blow strongly and consistently from west-to-east keeping Arctic air locked up in the polar region. When the AO index is negative, there tends to be high pressure in the polar region (i.e., high-latitude blocking), weaker zonal winds, and greater movement of polar air into the middle latitudes such as the Mid-Atlantic region.

Arctic Oscillation (AO, top) has been generally close to neutral in recent weeks whereas the North Atlantic Oscillation (NAO, bottom) has largely been in negative territory this month. Data courtesy NOAA/CPC
The NAO is a weather phenomenon in the North Atlantic Ocean of fluctuations in the difference of atmosphere pressure between the Icelandic low and Azores high. It controls the strength and direction of westerly winds and the location of storms tracks across the North Atlantic. It is part of the Arctic Oscillation and varies over time with no particular periodicity. During winters when the NAO is in its positive mode, the presence of the strong high-pressure and strong low-pressure systems produces warmer, wetter conditions over northern Europe and most of northeastern North America. During winters governed by the negative mode of the NAO, colder conditions are brought to eastern North America and northern Europe mainly by more-frequent intrusions of Arctic air. North America receives additional snow, while Europe receives less precipitation than normal.
Observations have shown that trends that develop in the autumn with respect to teleconnection indices such as the AO and NAO often foreshadow what will happen in subsequent winter months. The AO index has been generally flirting with the “neutral” region in recent weeks whereas the NAO has been primarily in “negative” territory during the month of October.
The bottom line
The Mid-Atlantic region should experience normal to slightly above-normal temperatures for the 2021-2022 winter season and normal-to-slightly above-normal snowfall amounts. The winter of 2021-2022 could turn out to be “front-loaded” and get off to a quick start later in November and there are strong signals for a colder-than-normal December raising the prospects for some accumulating snow before Christmas. Similar to last winter, there may be a tendency for snowfall to be higher “relative-to-normal” in areas to the north of the Pennsylvania/Maryland border.
In terms of specific numbers for the Mid-Atlantic region, temperatures should average from 0.5-1.5°C above-normal for the winter season, but the month of December could very well turn out to be colder-than-normal. Snowfall estimates in the DC-to-Philly-to-NYC corridor are as follows:
Slightly above-normal in Philadelphia, PA with ~25 inches in the city and ~30 inches in the N/W suburbs (average at PHL Airport is 22.6”),
Near-normal in Washington, D.C. with ~15 inches in the District and ~20 inches in the N/W suburbs (average at DCA Airport is 15.6”),
Slightly above-normal in New York City with ~30 inches in Central Park and ~35 inches in the N/W suburbs (average in Central Park is 26.1”).
This “winter outlook” is largely based upon an analysis of sea surface temperature anomalies expected this winter season, an evaluation of selected analog years, and a consideration of the prospects for high-latitude blocking events. Elsewhere in the US, colder-than-normal conditions appear likely this winter across the western states and drier weather conditions compared to normal should dominate across much of the southern US with particularly dry conditions possible in southern California. We will continue to closely monitor all of these oceanic, atmospheric and solar factors over the next several weeks as we progress towards the winter of 2021-2022.
Meteorologist Paul Dorian
King of Prussia, PA
Video discussion: