
*The outlook for the month of February…stormy pattern to continue for California…stratospheric warming, teleconnection indices suggest plenty of winter left for the central and eastern US*
Paul Dorian

The overall upper-level weather pattern across North America is likely to transition by the middle of the month to one with high-latitude blocking over Canada (shown in orange) and below-normal heights (shown in blue) across the southern US. This low pressure trough across the southern US can extend all the way from the Pacific to Atlantic Ocean. The southern US trough will be associated with an El Nino enhanced southern branch of the jet stream and it will result in multiple storm systems for California and the rest of the US west coast. Map courtesy ECMWF, Weather Bell Analytics
Overview
My fellow Pennsylvania prognosticator, Punxsutawney Phil, and I have a little bit of a disagreement about the coming six weeks as he has predicted an early spring while I believe there is plenty of winter left across much of the nation and it will not be an early spring for most…hopefully, he turns out to be right. In terms of temperatures, after a very cold middle of the month of January, a “January thaw” developed that brought temperatures to above-normal levels for much of the last ten days or so. The month of February is likely to start off warmer-than-normal across much of the central and eastern US and colder-than-normal out west. However, the overall temperature pattern looks to change by the middle of the month to colder-than-normal for much of the nation and that change can take us right into the middle of March. Support for this kind of pattern change comes from an on-going stratospheric warming event and numerous teleconnection indices which can provide clues as to future weather patterns across the US based on what is trending in other parts of the world.
In terms of precipitation, an “El Nino enhanced” southern branch of the jet stream has already resulted in one powerful storm system for California that will now slide across the Rocky Mountain States to the southeastern US. A second and perhaps even more powerful Pacific Ocean storm will slam into the Golden State later this weekend and into the early part of next week. Several inches of rain will accumulate in California across low lying areas and tremendous snowfall in the higher elevation locations such as the Sierra Nevada Mountains. The Deep South and southeast US can experience severe thunderstorms later this weekend.
El Nino conditions in the tropical Pacific Ocean have gotten a “jolt” in recent days due to a burst of westerly winds and this sudden surge in strength will play a big role in the intensification of the southern branch of the jet stream. The phrase “atmospheric river” or “pineapple express” will be used quite often during the next couple of weeks as a powerful and relentless jet stream over the Pacific Ocean continues to inundate the US west coast with copious amounts of moisture.
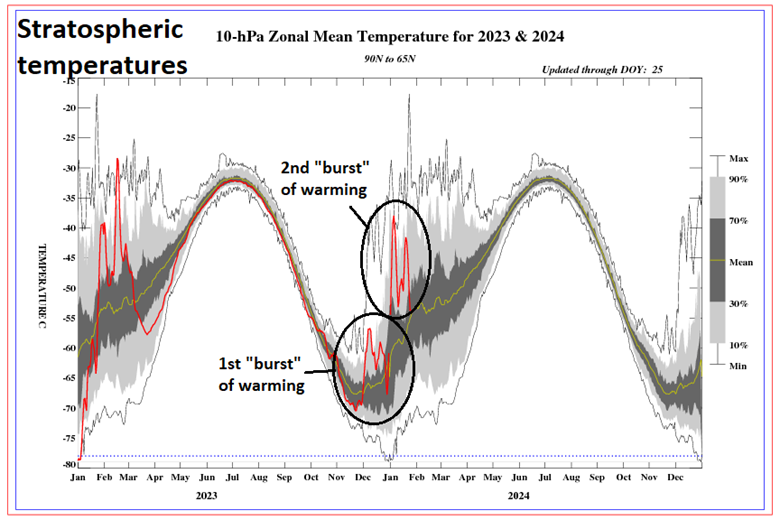
A stratospheric warming event over the polar region of the northern hemisphere has come in two waves or “bursts” this winter season and a third episode may take place later this month. The first wave began during late November and continued into mid-December and the second one in the early and middle portions of January. There is a lag of several weeks between the time the “burst” of stratospheric warming takes place and the ultimate impact on US temperature patterns. As a result, this second wave should result in cold air outbreaks across much of the US during the middle and latter parts of February and perhaps well into the month of March. Map courtesy NOAA
Stratospheric warming
One of the driving factors for a change back to a colder-than-normal pattern across much of the US during the month of February is a stratospheric warming event that disrupted the polar vortex and featured one spike in temperatures that lasted from late November into mid-December and a second burst that took place during the early and middle parts of January. There are even signs that a third burst of stratospheric warming will take place over the polar region by the middle of the month. There is usually a lag time of several weeks (4-6) for a stratospheric warming event over the polar region to have an impact on temperature patterns across the US. As a result, the first surge of stratospheric warming likely contributed to our very cold middle part of January and the second wave should contribute to a colder-than-normal pattern for the middle and latter parts of February and this upcoming pattern change may last right into mid-March.
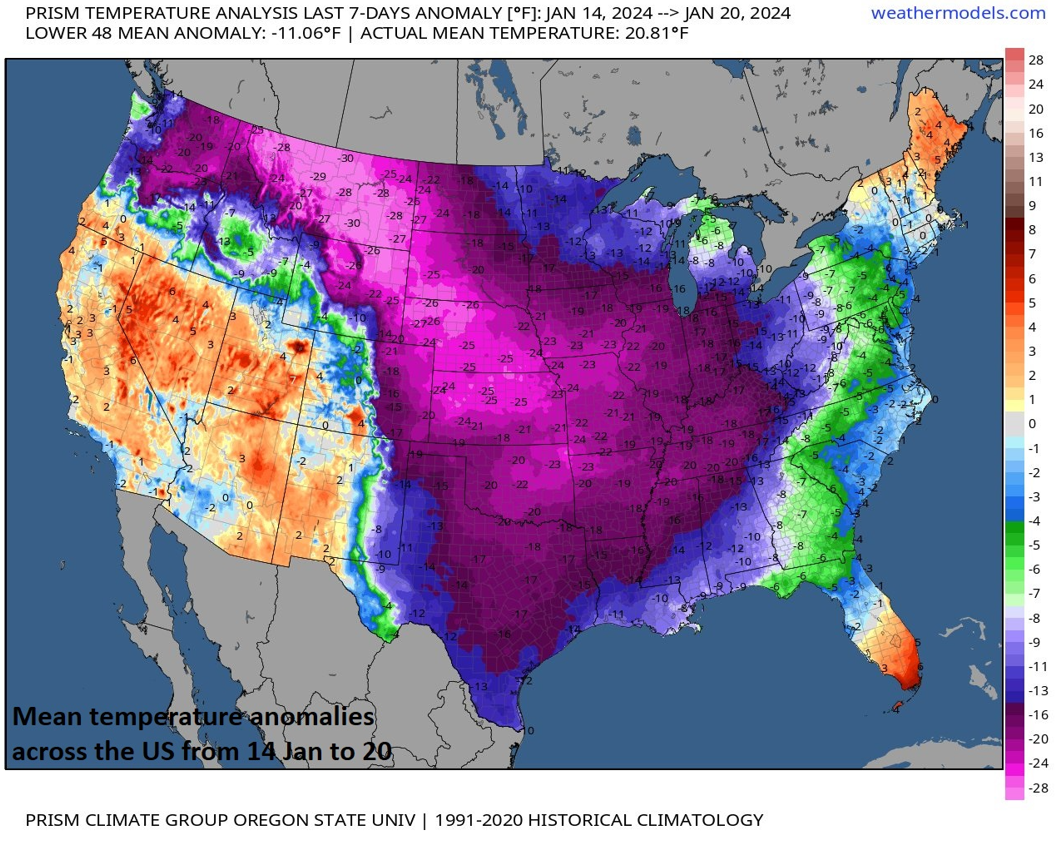
The middle week of January was very cold relative-to-normal across much of the nation and a large factor is likely to have been the stratospheric warming that took place in polar regions from late November into mid-December. Map courtesy PRISM Oregon State University, weathermodels,com, NOAA
The stratosphere is the second major layer of the atmosphere just above the troposphere and below the mesosphere. It occupies the region of atmosphere from about 12 to 50 km, although its lower boundary tends to be higher nearer the equator and lower nearer the poles. The stratosphere defines a layer in which temperatures rise with increasing altitude. At the top of the stratosphere, the thin air may attain temperatures close to 0°C. This rise in temperature is caused by the absorption of ultraviolet (UV) radiation from the sun by the ozone layer. Such a temperature profile creates very stable atmospheric conditions and the stratosphere lacks the air turbulence that is so prevalent in the troposphere. Consequently, the stratosphere is almost completely free of clouds or other forms of weather.
Sudden stratospheric warmings (SSWs) are among the most impressive dynamical events in the physical climate system. During the winter months in the polar stratosphere, temperatures are typically at or below minus 70°C. The cold temperatures are combined with strong westerly winds that form the southern boundary of the stratospheric polar vortex which plays a major role in determining how much Arctic air spills southward toward the mid-latitudes. This dominant structure is sometimes disrupted in some winters by being displaced, split apart or even reversed. Under these circumstances, the winds can decrease or change directions and the temperatures in the lower stratosphere can rise by more than 50°C in just a few days.
In response to the stratospheric warming (and associated layer expansion) at the high latitudes, the troposphere cools down dramatically underneath (with layer contraction) at the high latitudes and pressures rise. This tropospheric cold air can then be more easily transported from the high latitudes to the middle latitudes given the "high-latitude blocking" that often sets up over places like Greenland and northeastern Canada. [For more information on the stratospheric warming phenomenon visit our “Meteorology 101” page for an extended video discussion on the topic].

A teleconnection index known as the Madden-Julian Oscillation or MJO tracks a recurring tropical disturbance that travels along the tropics on a regular basis. Depending on its location or “phase”, it can provide important clues as to temperature and precipitation patterns that can develop in other parts of the world away from the tropics. During this time of year, a movement by the MJO into phases 8 and 1 usually results in colder-than-normal weather conditions for much of the central and eastern US. As we progress into the middle of February, the MJO is indeed predicted to rotate in a counter-clockwise fashion into these particular (cold) phases (as indicated by the blue circles (Day 15) and green circles (Day 20) in the above diagram). Map courtesy ECMWF, NOAA
A look at the month of February using teleconnection indices (MJO, EPO, PNA, NAO, AO)
In addition to the stratospheric warming “burst” that took place in early-to-mid January, other support for a mid-February pattern change to a colder-than-normal comes from what are known as teleconnection indices. These indices are used by meteorologists to provide information on temperature, pressure, and precipitation patterns in other parts of the world such as the North Atlantic, Pacific Ocean or tropics and their trends can provide clues as to what kind of weather patterns may develop across the US in the near and medium term.

“Phases” 8 and 1 (boxed in) for the MJO index generally are associated with colder-than-normal temperatures across much of the central and eastern US. Map courtesy NOAA

This map shows the 500 mb height anomalies during the month of February in an El Nino winter when the MJO is in “Phase 8” and it looks quite similar to the ECMWF EPS forecast map for February shown at the top of this posting. Map courtesy NOAA/NCEP
A look at the teleconnection index known as the Madden-Julian-Oscillation or MJO which tracks a tropical disturbance indicates it will transition during February to “phases” or locations which are normally associated with colder conditions across the eastern and southern US. The MJO is the major fluctuation in tropical weather on weekly-to-monthly timescales and can be characterized as an eastward moving “pulse” of clouds and rainfall near the equator that typically recurs every 30-to-60 days. The MJO phase diagram illustrates the MJO index through different phases which generally coincides with locations along the equator around the globe. When the MJO index is within the center circle, it is considered weak and when it is outside, it is stronger and usually moves in a counter-clockwise direction. The different phases of the MJO correlate well with different temperature and precipitation patterns around the world depending on the time of year. The current forecast of the MJO suggests it will propagate into the “colder” phases of 8 and 1 later this month which usually results in colder-than-normal weather across much of the central and eastern US.

The East Pacific Oscillation or EPO is predicted to slide into “negative” territory as we transition into the month of February which is often correlated with high pressure ridging over Alaska and a trough of low pressure in the eastern US. Plot courtesy ECMWF, weathermodels.com

The Pacific North American index of PNA is predicted to stay in “positive” territory as we transition into the month of February which often is correlated with high pressure ridging near the US and Canadian west coasts. Plot courtesy ECMWF, weathermodels.com

The North Atlantic Oscillation or NAO is predicted to slide into “negative” territory as we transition into the month of February which often is correlated with high pressure ridging and “blocking” near Greenland and northern Canada. Plot courtesy ECMWF, weathermodels.com

The Arctic Oscillation or AO is predicted to slide into “negative” territory as we transition into the month of February which often is correlated with high pressure ridging and “blocking” across Canada. Plot courtesy ECMWF, weathermodels.com
Four other teleconnection indices known as the Eastern Pacific Oscillation (EPO), Pacific North America (PNA), Arctic Oscillation (AO) and North Atlantic Oscillation (NAO) are trending in directions that generally support the idea of colder-than normal temperatures during the middle and latter parts of February across the central and eastern US. Specifically, a pattern that features -EPO, +PNA, -AO and -NAO usually results in high pressure ridging across Alaska and the west coasts of the US and Canada and high-latitude “blocking” across Canada and Greenland…both of which tend to be favorable for cold air outbreaks to make their from Canada into the central and eastern US. A big part of this pattern will also include an extended trough of low pressure located across the southern US that will “undercut” the large-scale high pressure ridging to the north. This low pressure trough across the southern US will be associated with the El Nino enhanced southern branch of the jet stream. One strong such storm has already hit California and a second powerful system arrives later this weekend.
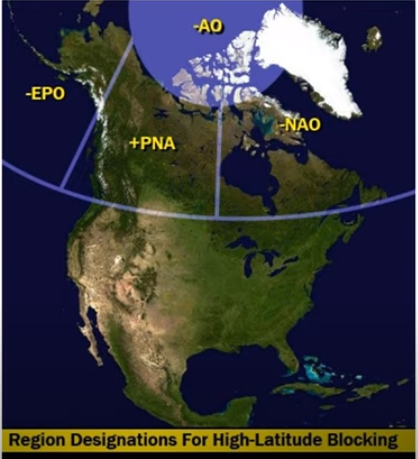
The combination of the predicted trends of teleconnection indices (i.e., -EPO, +PNA, -NAO, -AO) for later this month are generally quite favorable for “high-latitude blocking” and the influx of colder-than-normal air masses from Canada into the central and eastern US .
Stormy pattern to continue for California
Typical of El Nino winters, the “southern branch” of the jet stream is quite active and especially strong over the Pacific Ocean. In fact, there has been a westerly wind event across the equatorial Pacific Ocean in recent days and this is resulting in a quick intensification of El Nino and, in turn, this will further strengthen the southern branch of the jet stream heading into the early part of February. The jet stream across the Pacific will push ”atmospheric rivers” of moisture into the US west coast during the first couple weeks of the new month with one storm already pounding away and a second storm to arrive late in the weekend Low-lying areas out west will get pummeled by several inches of rain during this stretch and higher elevation, inland locations will receive several feet of snow such as in the Sierra Nevada Mountains of eastern California. This kind of anticipated stormy stretch of weather for California has happened many times before during other El Nino episodes including as in the winters of 1982-1983, 1977-1978, and 1969-1970.

The first couple of weeks of February will bring multiple storm systems into California from the Pacific Ocean. This first storm will move across the Rockies to the Deep South this weekend and a powerful second system arrives along the west coast on Sunday with additional tremendous amounts of rainfall and interior snows for California. Map courtesy NOAA, tropicaltidbits.com
After pounding the west coast, this initial ocean storm system will slide across the Rocky Mountain States -producing lots of snow for skiers - and then to the Deep South and Southeast US resulting in some severe thunderstorm activity. After that, it is likely to push over the western Atlantic Ocean - meander around for a few days - and is unlikely to have any kind of direct impact on the Mid-Atlantic region. There is shot, however, that it ultimately has some effect on the eastern New England coastline with strong winds by the middle of next week.

Snowfall amounts will be quite high in the higher elevation locations of the western US during the first couple weeks of February. This forecast map is for the total snowfall amounts between now and February 8th and 3+ feet of snow is indicated for the Sierra Nevada Mountains of eastern California. Map courtesy ECMWF, weather models.com (Dr. Ryan Maue, Twitter)

Groundhog Club handler A.J. Dereume holds Punxsutawney Phil during the celebration of Groundhog Day on February 2nd, 2023 in Punxsutawney, Pennsylvania. Photo courtesy Barry Reeger (AP)/CNN
One final important note to throw out there…pitchers and catchers report on Valentine’s Day!
Meteorologist Paul Dorian
Arcfield
arcfieldweather.com
Follow us on Facebook, Twitter, YouTube
Video discussion: